Spatial Data and Mapping for Sociologists
Last updated: 2025-11-04
Chapter 1 About
The social life is embedded in space. The advent of digital technology, once believed to jeopardize the significance of space, mediates and reconfigures how people experience and navigate places. From pandemic to climate change to globalizing gentrification and migration, there are abundant sociological inquiries that require the understanding of how social groups, institutions, and resources are spatially organized. This module is designed to equip students with tools that help them explore these topics.
The following is a series of tutorials prepared for the Spatial Data and Mapping module from Methods in Quantitative Sociology at ENSAE Paris. This module specifically aims to teach students how to gather, process, and visualize spatial data for sociological research. Some prior experience or familiarity with quantitative data and R/R Studio is necessary to follow the tutorials. However, no prior experience in spatial data and/or software is assumed.
- Before the class, make sure you have R/R studio installed.
- You can download all the data used in the tutorials here.
- There is no textbook for this module. However, [Practical Handbook of Thematic Cartography] (https://www.google.fr/books/edition/Practical_Handbook_of_Thematic_Cartograp/g7fjDwAAQBAJ?hl=en&gbpv=0) (Lambert and Zanin, 2020) is highly recommended.
Each tutorial is a chapter in this website. You can navigate through the chapters using the sidebar.
1.1 Spatial Data and Analysis
Spatial data refers to data representing features or objects on the Earth’s surface. Whether it’s man-made or natural, if it has to do with a specific location on the surface of the Earth, it is spatial. Spatial data is typically classified into two types: Vector data and raster data. Vector data represents geographic data symbolized as points, lines, or polygons. Raster data represents geographic data as a matrix of cells that each contains an attribute value. In this series of tutorials, we focus on the vector data type.
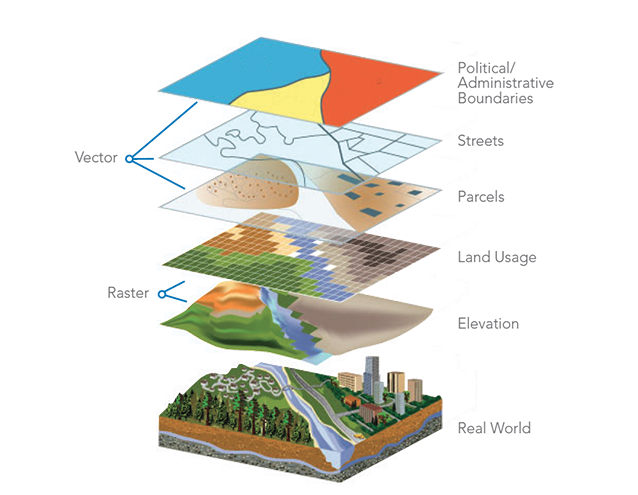
Representing Real World Through Spatial Data
There are three forms of vector data.
- Points: A single dot, expressed as a coordinate (e.g., landmarks).
- Lines: A line defined by two coordinates, with a definite length (e.g., roads, rivers)
- Polygons: A closed shape is defined using three or more coordinates, representing areas (e.g., neighborhood boundaries).
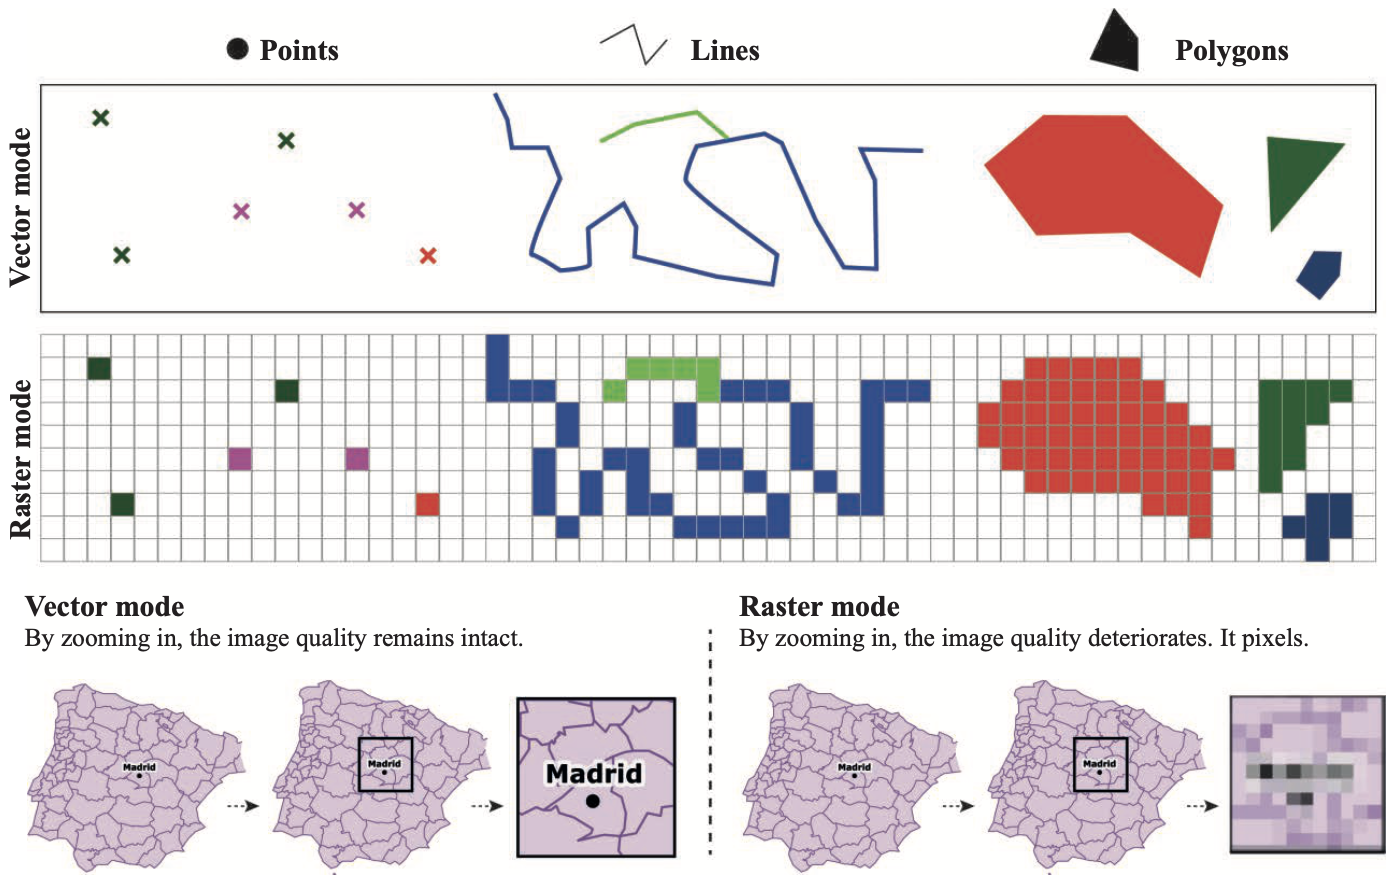
Types of Spatial Data. Source: Lambert and Zanin (2020)
Spatial data contains more information than just a location on the surface of the Earth represented by vector data. Any additional information, or non-spatial data, that describes a feature is referred to as an attribute. Sociologists utilize a variety of non-spatial data, such as demographic and socioeconomic data linked to particular locales.
ANALYTIC TOOLS
Spatial data analytics involves collecting, processing, and analyzing various types of spatial data. The results are often descriptive, which involves summarizing and visualizing spatial data to identify patterns and relationships in geographic contexts.
While there are multiple tools to carry out spatial analysis, we will use R in this tutorial. R provides sufficient spatial packages prepared for data manipulation, visualization, and analysis for social scientists. It can also be readily linked with more traditional statistical analysis. Last but not least, using R is helpful for open science and replication, which is increasingly important in social science research.
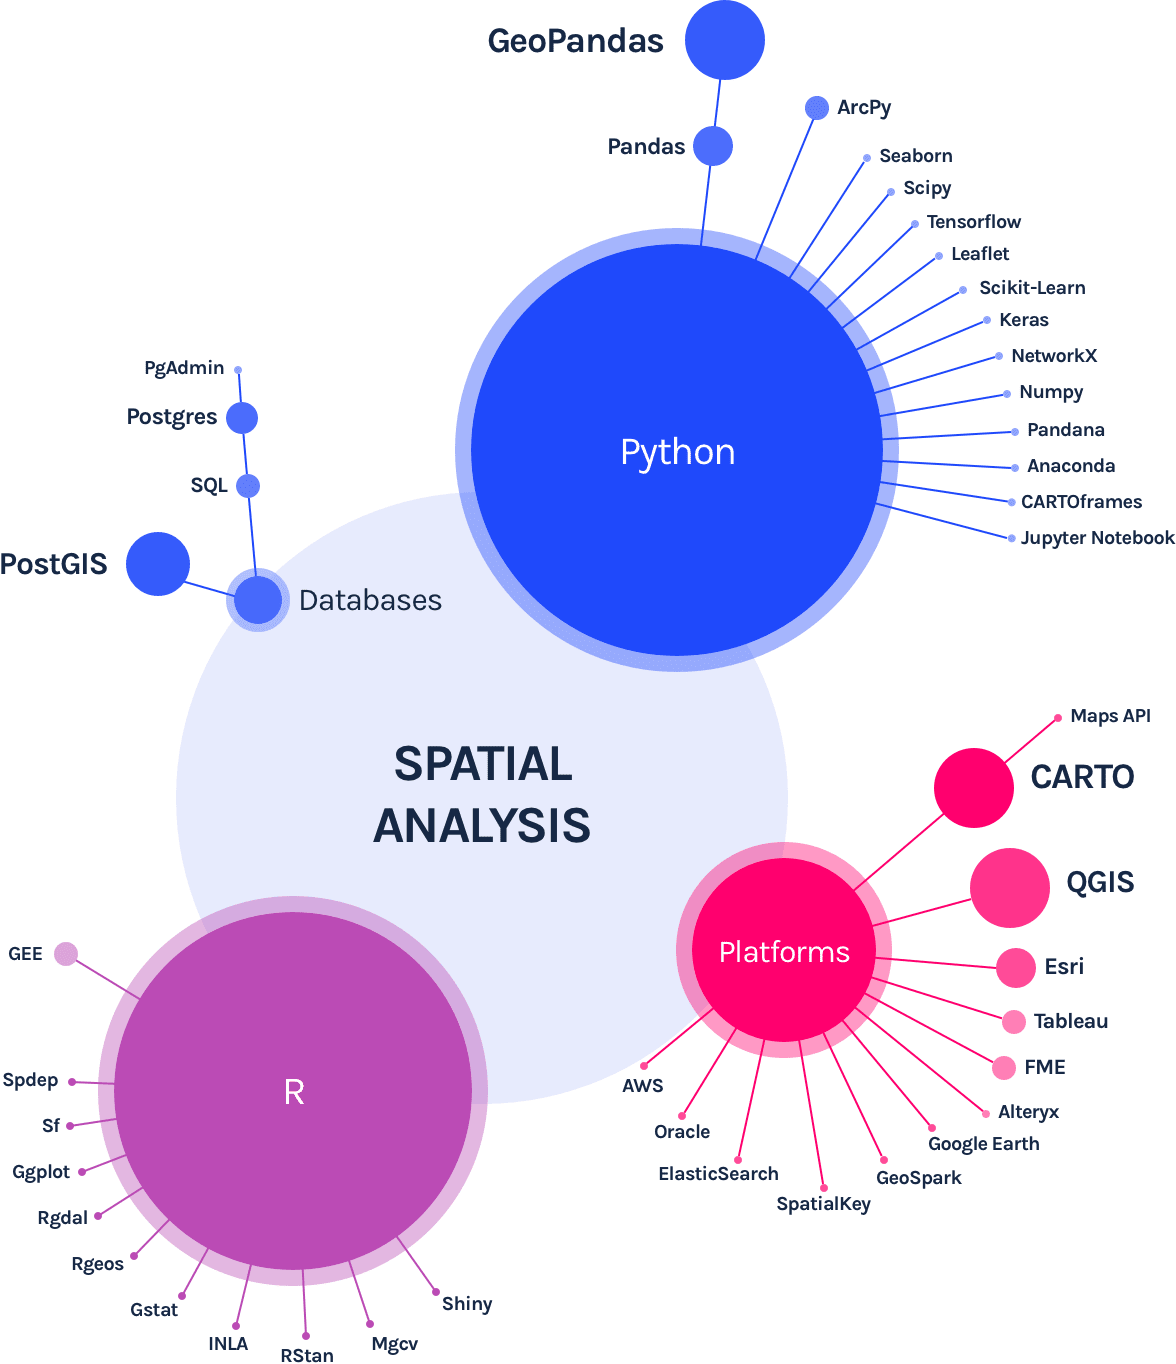
Tools for Spatial Analysis. Source: CARTO)
LEARN MORE
Geomatics with R is a tutorial developed by RIATE (https://riate.cnrs.fr/riate.html). Specifically, it provides how to use terra package for handling raster data type.